ResearchFindingsPublicationsPeopleContactProtocol on GitHub ↗
Findings

Measured from the outside, not marketed.

Pre-publication figures from the program’s frozen analyses. Both papers are in preparation; the published versions take precedence over anything shown here.

Key result

Price steering by seed-price band.

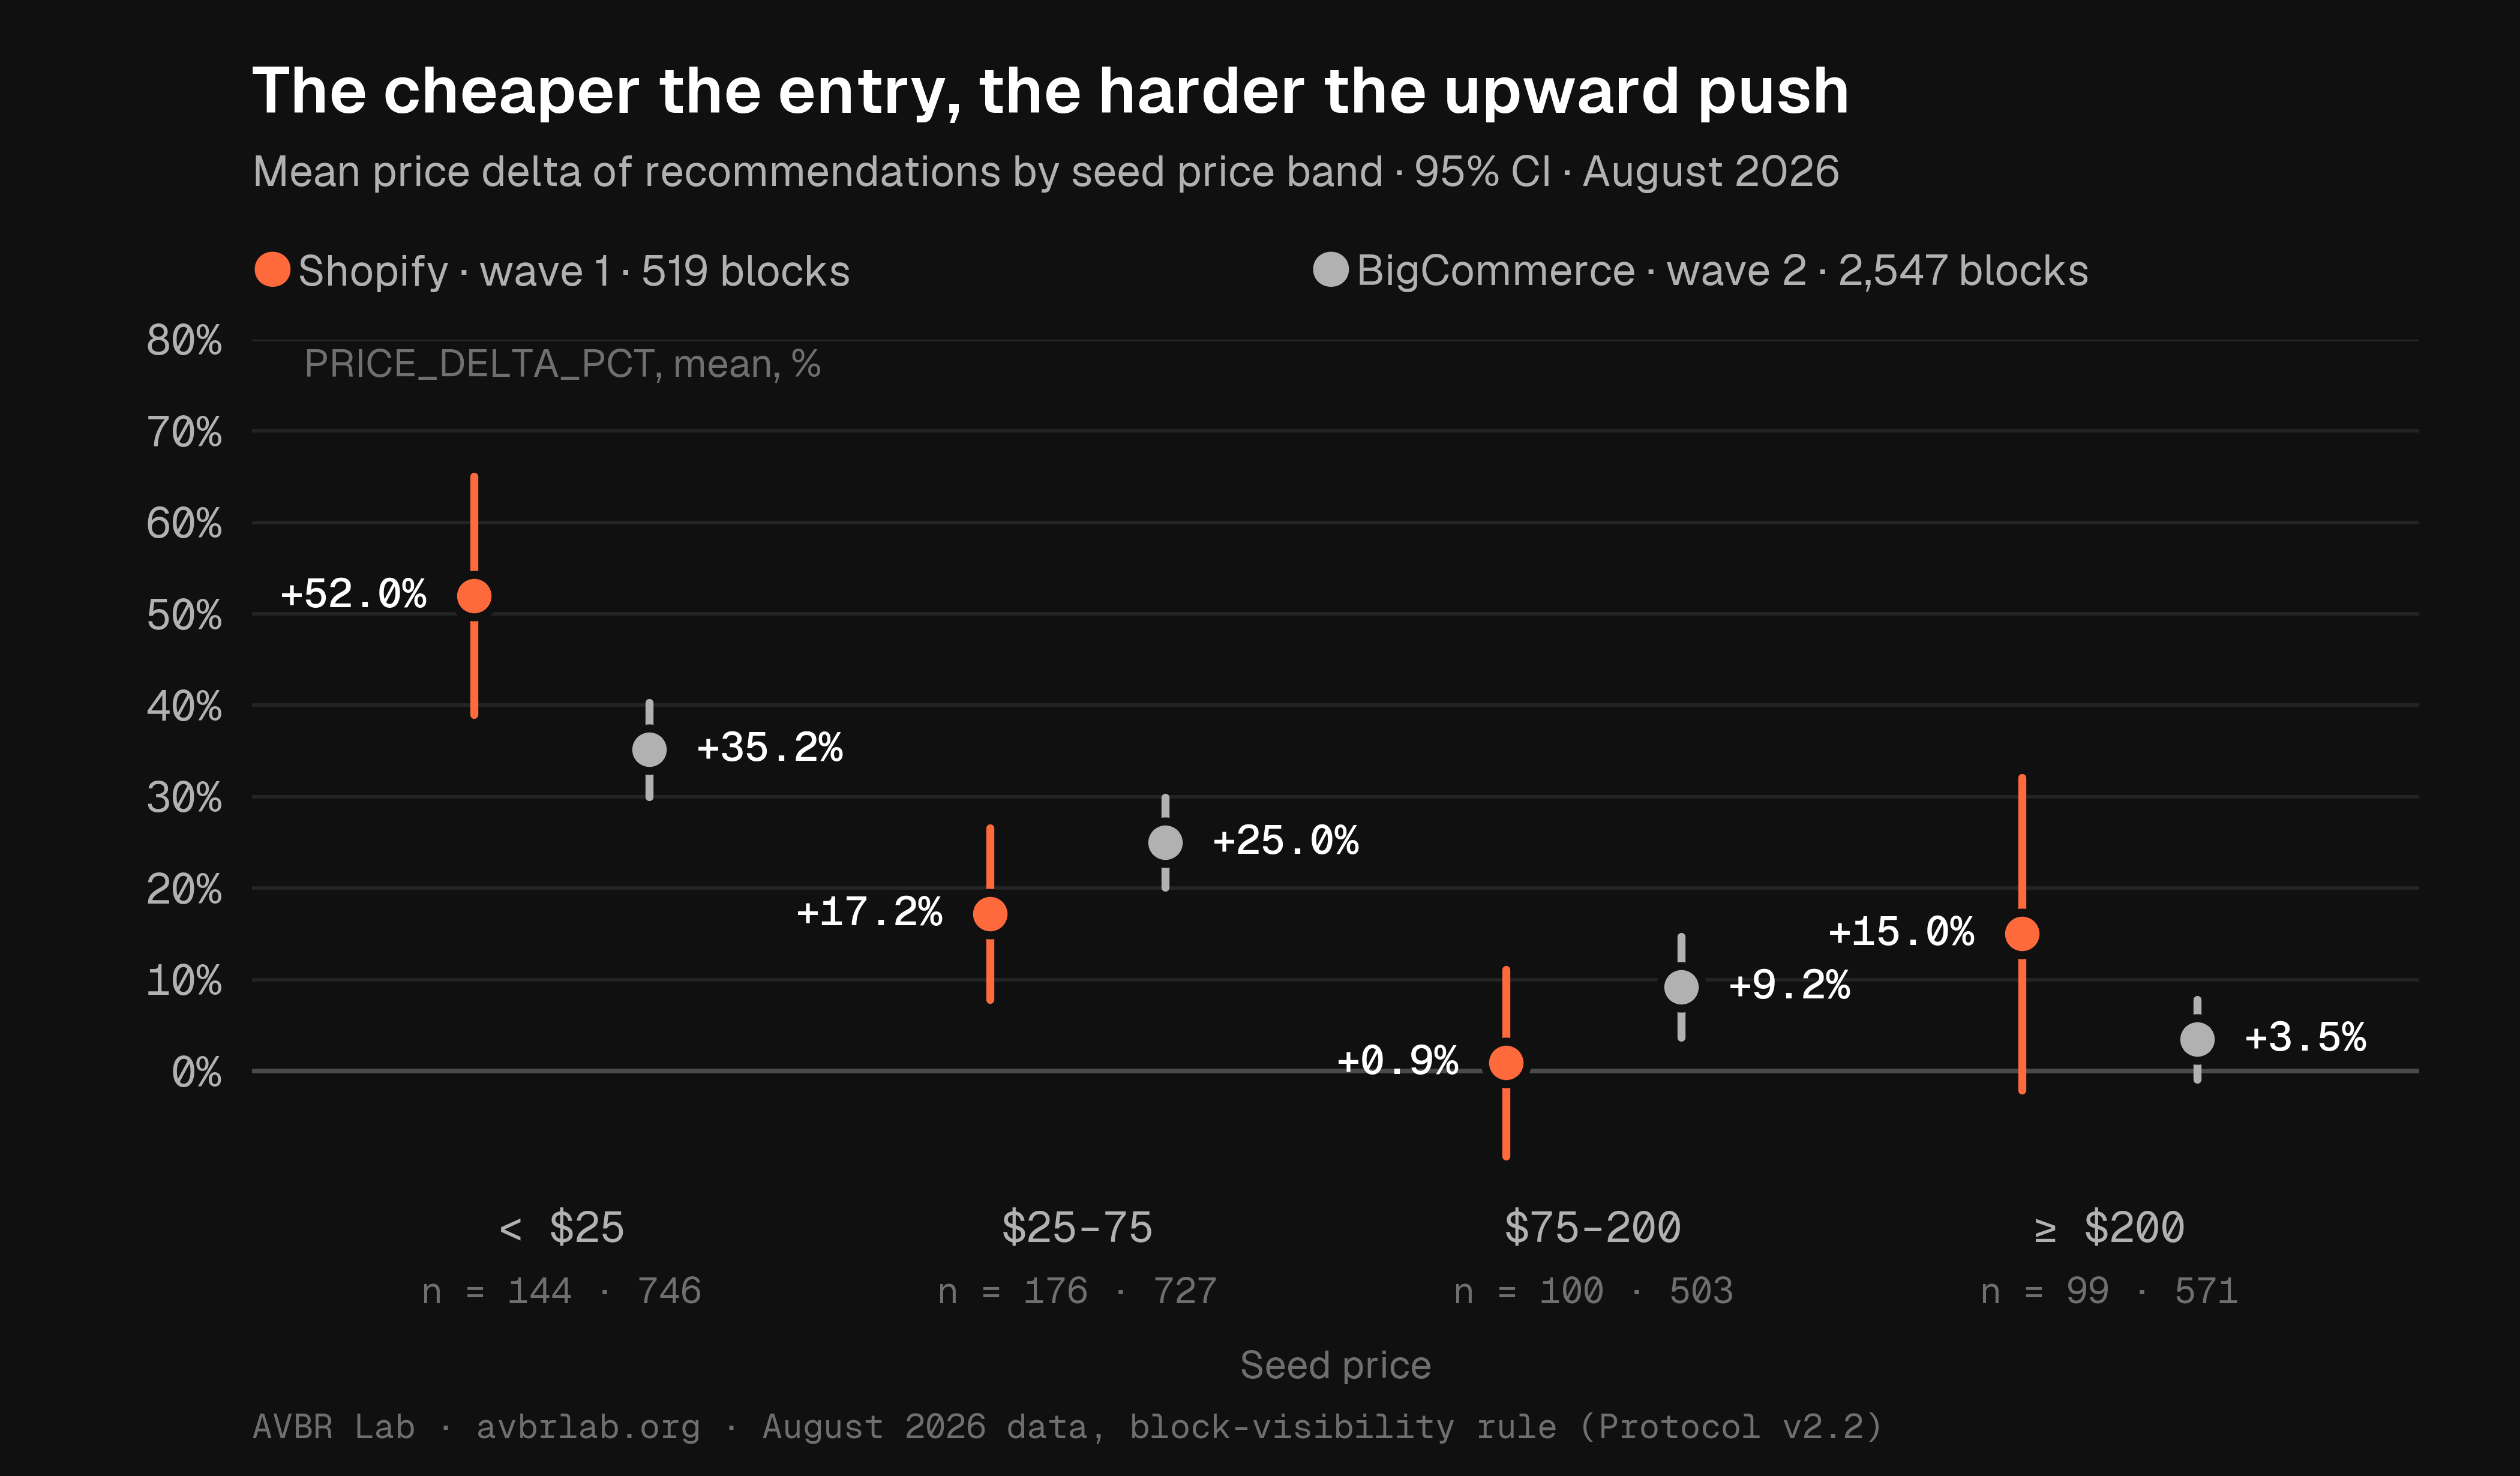
How much pricier are recommendations than the product being viewed? Mean price delta of recommendations, % above the viewed product, by the price band of the seed product.
Seed price band
Shopify · wave 1
BigCommerce · census
Blocks · Shopify
Under $25half-open band · winsorized [−100%, +200%]
+52.0%
+35.2%
144 blocks
$25–75half-open band · winsorized [−100%, +200%]
+17.2%
+25.0%
176 blocks
$75–200half-open band · winsorized [−100%, +200%]
+0.9%
+9.2%
100 blocks
Over $200half-open band · winsorized [−100%, +200%]
+15.0%
+3.5%
99 blocks
Blocks with comparable prices: Shopify 519 · BigCommerce 2,547. Pre-publication figures, recomputed 29 Sep 2026 under the block-visibility rule (protocol amendment v2.2, to be published with the papers: only blocks visible on the product page count); earlier figures are kept in the papers’ supplementary material. Both papers are in preparation.Cross-checked with article drafts · Sep 2026
Central finding

The cheaper the product a shopper starts from, the harder the algorithm pushes them toward pricier recommendations.

Replicated across two platforms: the direction and shape reproduce; between-category differences do not.

Charts

Three views of one gradient.

The same frozen analyses, drawn: the three figures prepared for Article 1, in the site’s dark version.
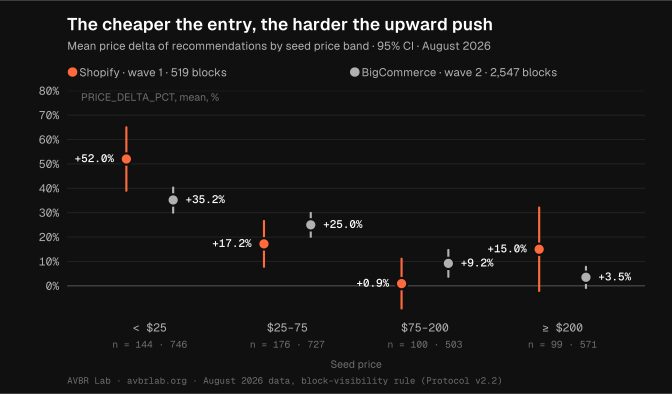
Dot chart with 95% confidence intervals. Mean price delta of recommendations by seed price band, August 2026. Shopify, 519 blocks: under $25 +52.0%, $25–75 +17.2%, $75–200 +0.9%, over $200 +15.0%. BigCommerce, 2,547 blocks: +35.2%, +25.0%, +9.2%, +3.5%.
Figure 1Mean price delta of recommendations by seed price band · 95% CI · August 2026. Shopify wave 1 (519 blocks) and BigCommerce census (2,547 blocks). PNG · SVG
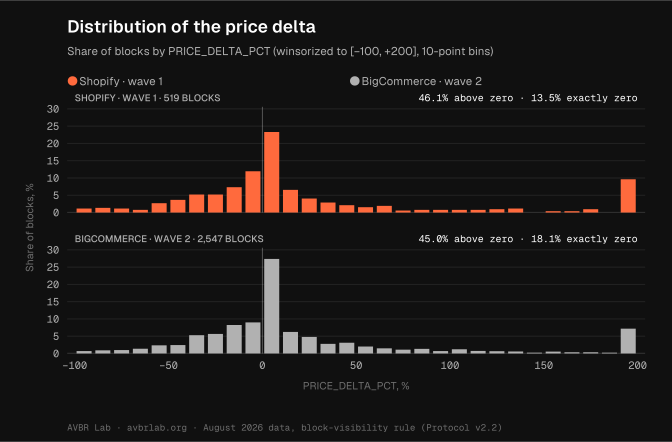
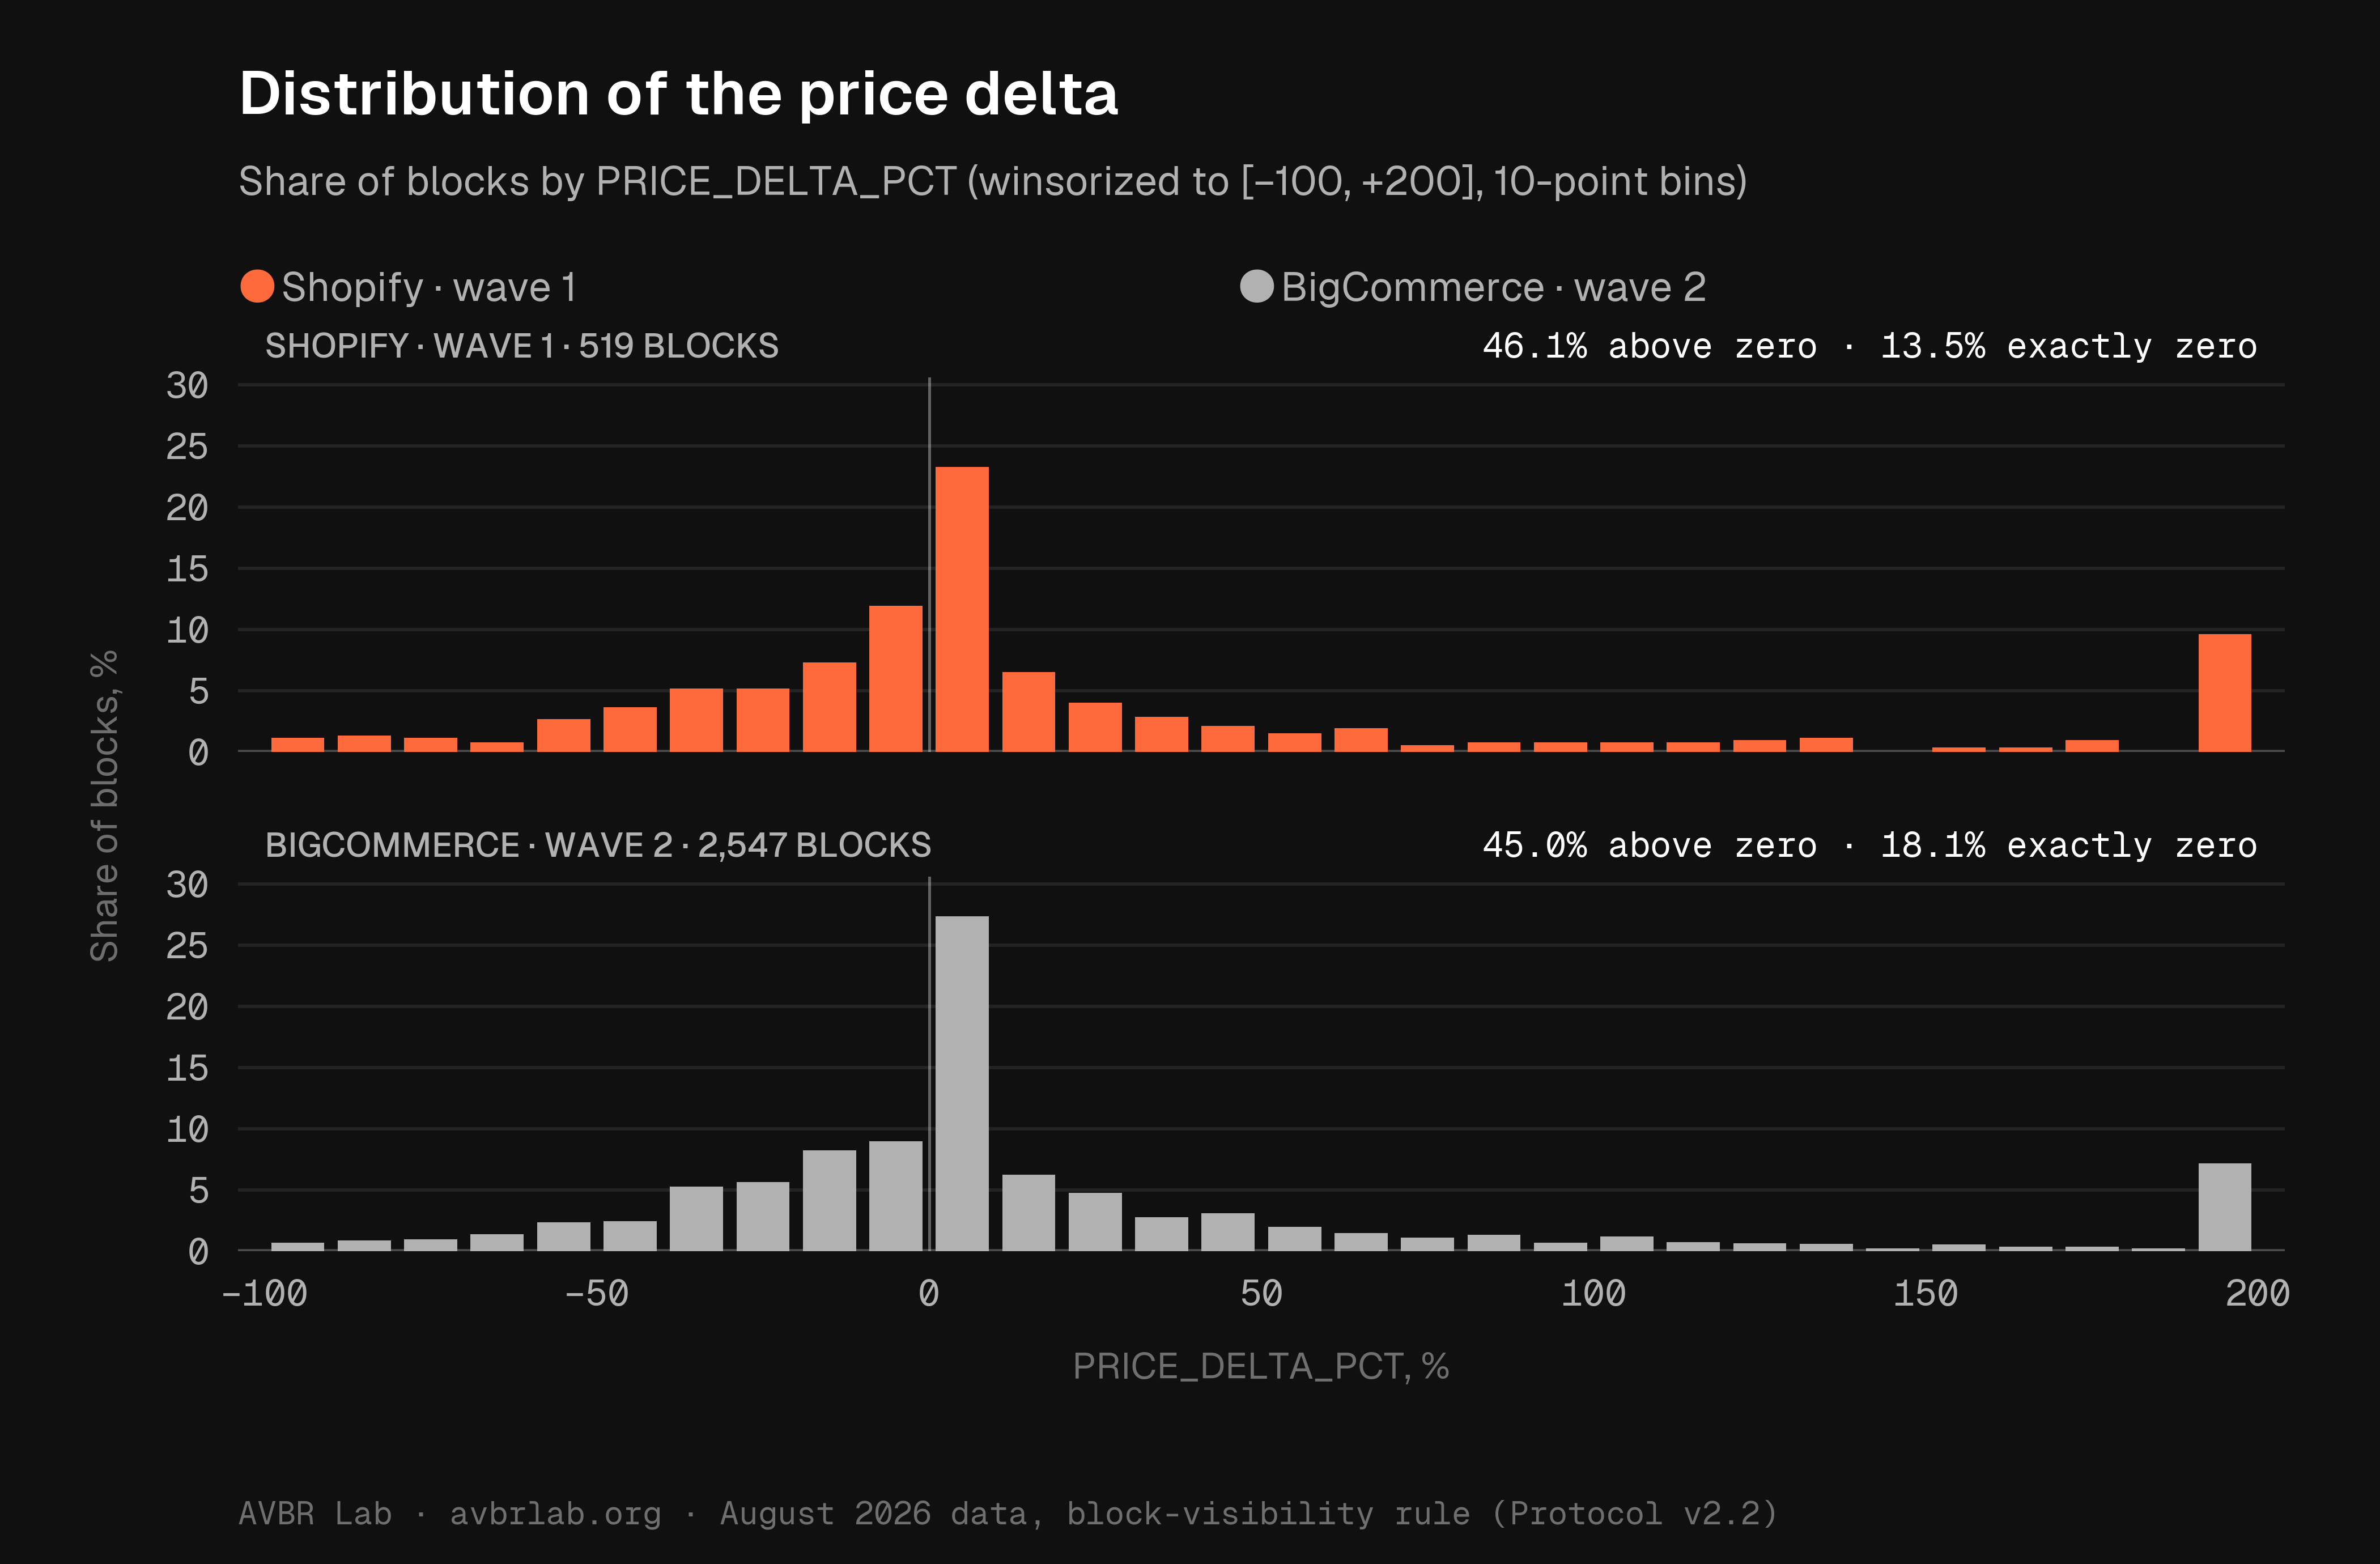
Two histograms, share of blocks by price delta in 10-point bins from −100% to +200%. Shopify, 519 blocks: 46.1% of blocks above zero, 13.5% exactly zero. BigCommerce, 2,547 blocks: 45.0% above zero, 18.1% exactly zero. Both distributions have a spike at zero and a long right tail.
Figure 2Distribution of PRICE_DELTA_PCT, winsorized to [−100, +200], 10-point bins. The share of blocks above zero and exactly at zero is printed on each panel. PNG · SVG
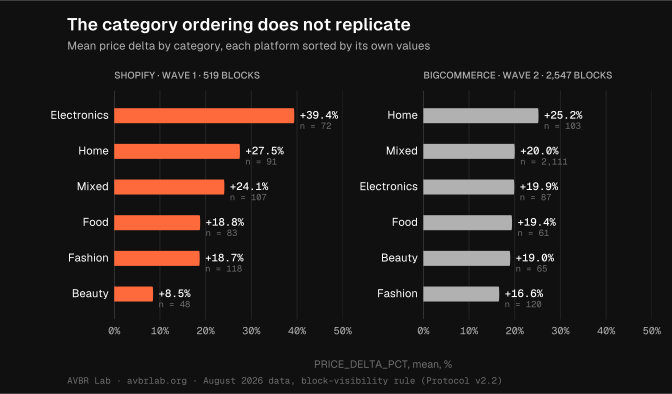
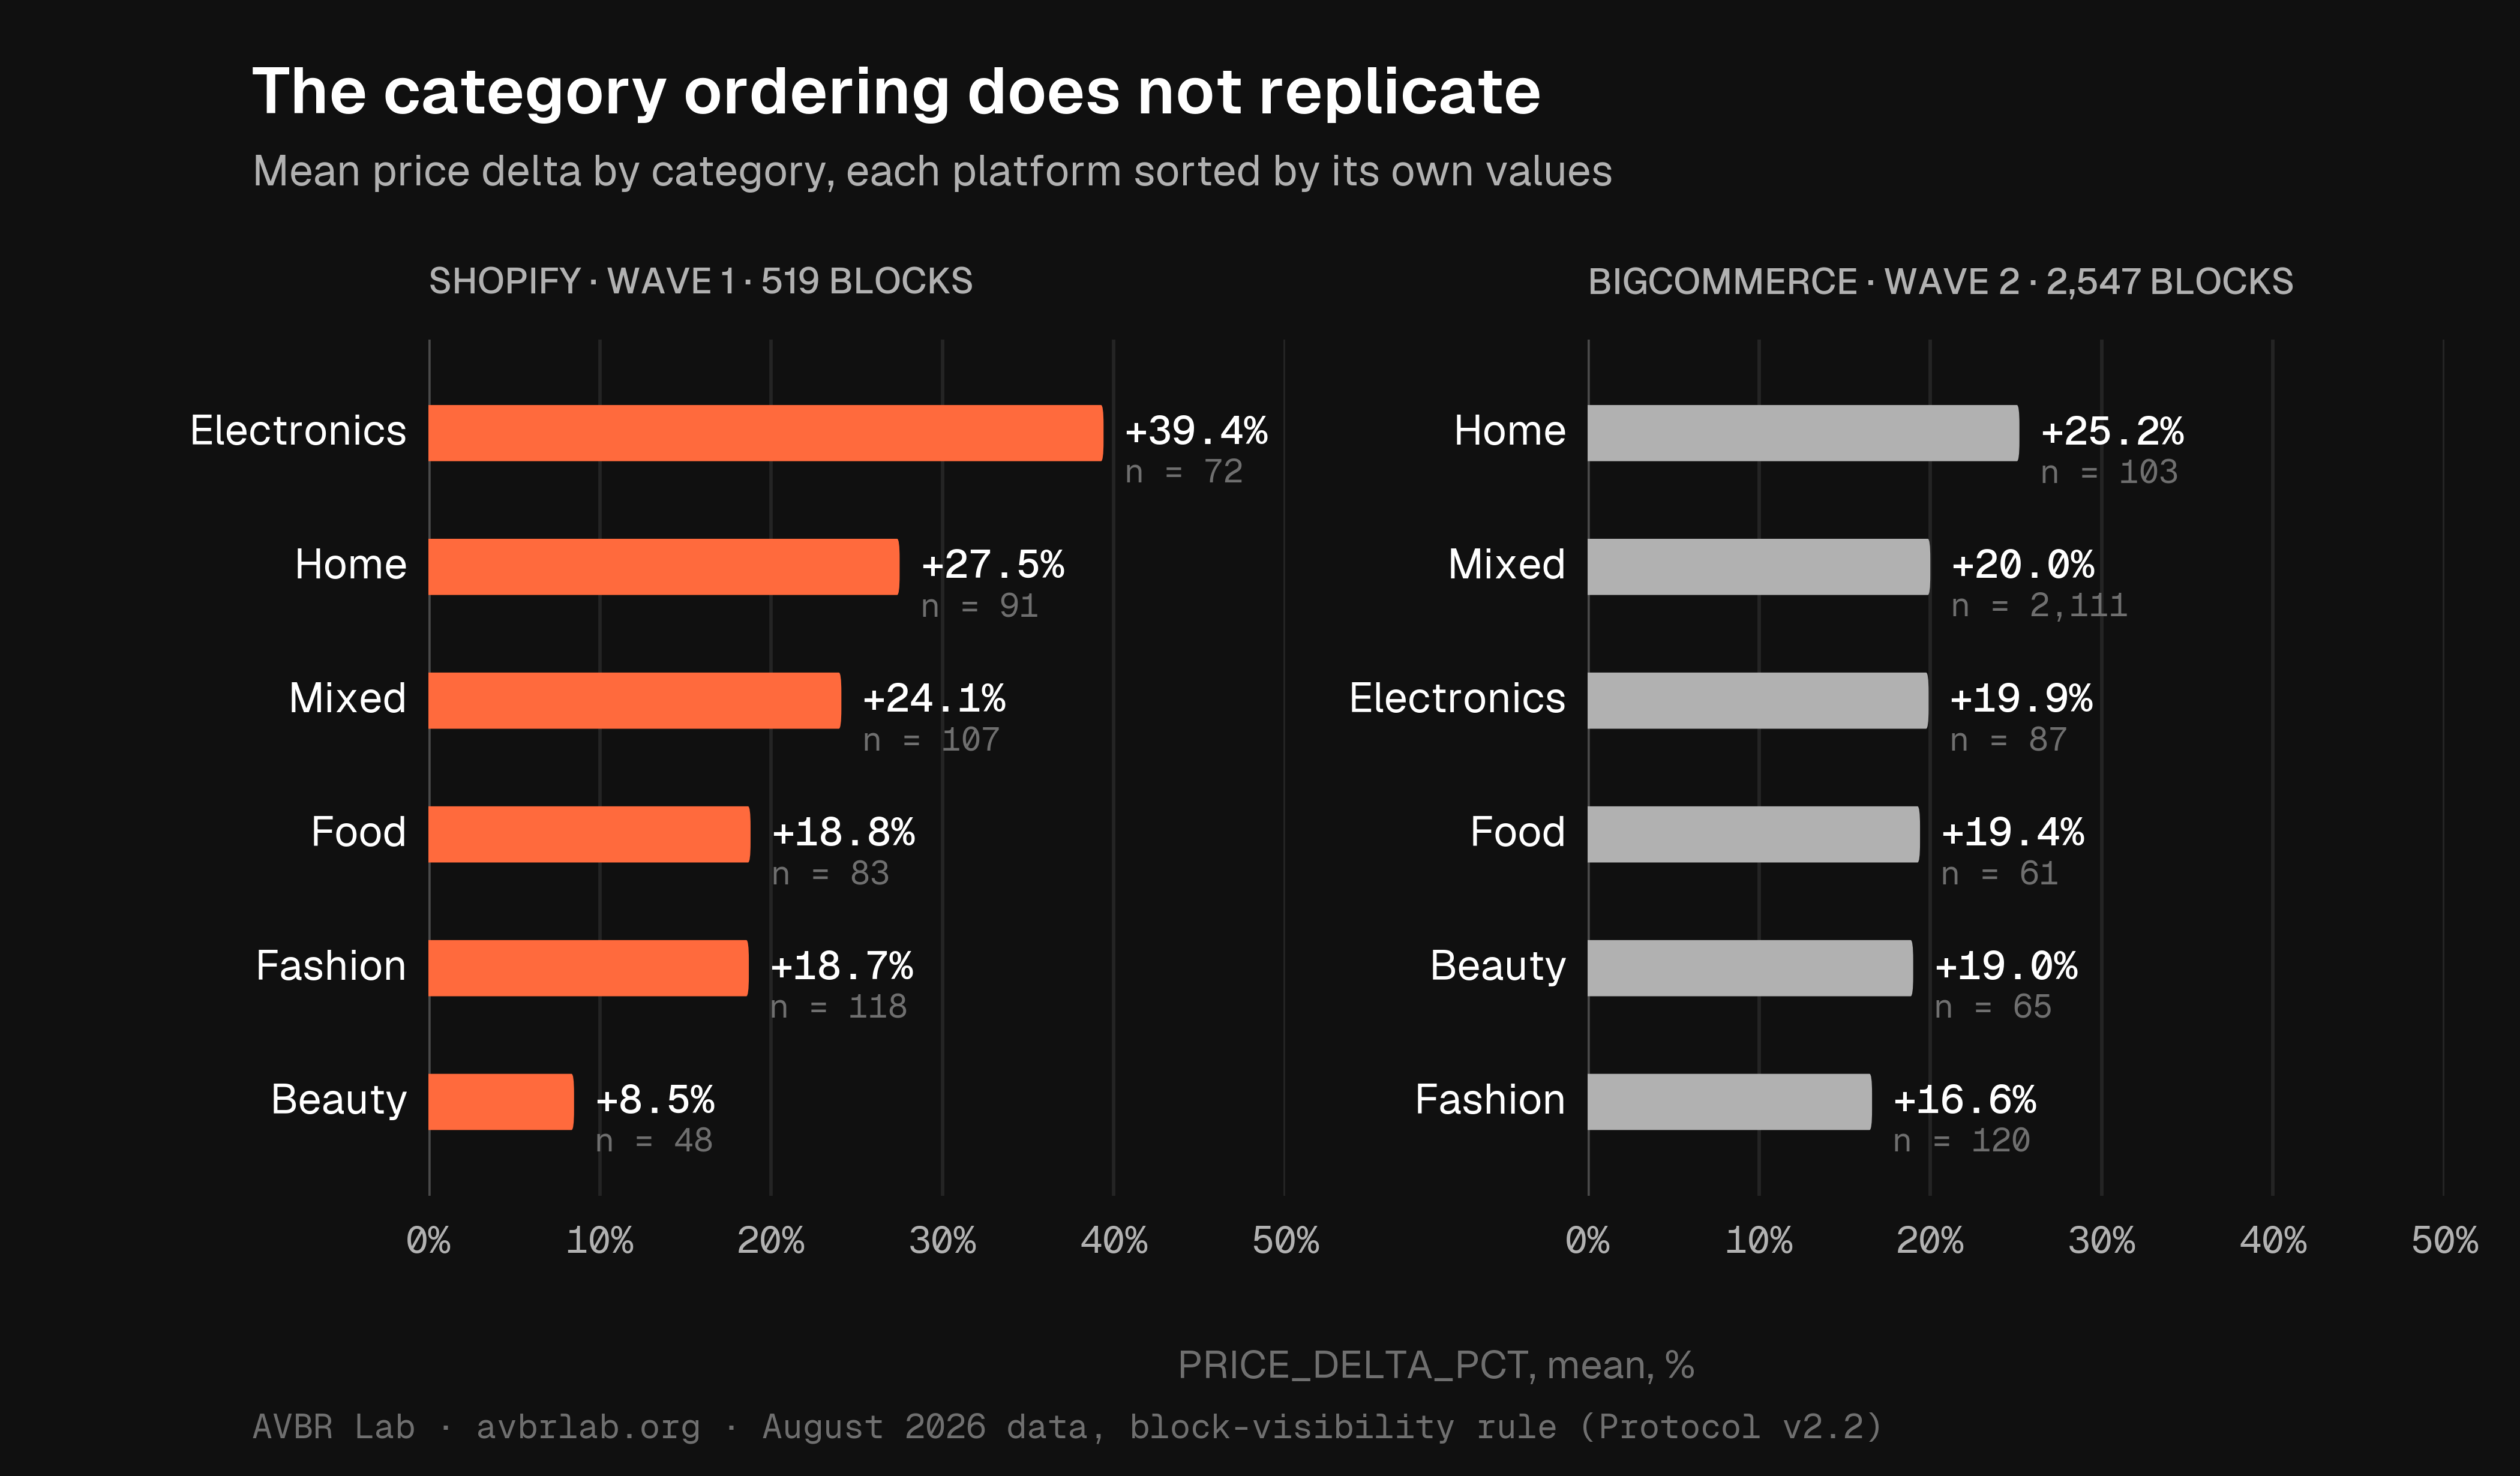
Two ranked bar charts of mean price delta by store category, each platform sorted by its own values. Shopify, 519 blocks: Electronics +39.4%, Home +27.5%, Mixed +24.1%, Food +18.8%, Fashion +18.7%, Beauty +8.5%. BigCommerce, 2,547 blocks: Home +25.2%, Mixed +20.0%, Electronics +19.9%, Food +19.4%, Beauty +19.0%, Fashion +16.6%. The ordering differs between platforms.
Figure 3Mean price delta by category, each platform sorted by its own values. The direction replicates across platforms; the category ordering does not. PNG · SVG
Figures rendered from the frozen wave-1 and census tables under the block-visibility rule (protocol amendment v2.2, to be published with the papers). Pre-publication; the published versions take precedence.Data frozen 29 Sep 2026
Spec sheet

Metrics first. Adjectives never.

Cross-checked with article drafts · 2026-09Shopify · BigCommerce
Price steering
Mean price delta · seed under $25+52.0% · +35.2%
Seed $25–75+17.2% · +25.0%
Seed $75–200+0.9% · +9.2%
Seed over $200+15.0% · +3.5%
Blocks with comparable prices519 · 2,547
Upsell share0.38 · 0.35
Popularity loop
Top-20 overlap (POP_OVERLAP)0.19 · 0.21
Stores with a reliable best-selling sort191 · 852
Brand lock-in
Single-brand blocks (BRAND_HHI = 10,000)53% · not exposed
Blocks · stores350 of 657 · —
Single-brand blocks within multi-brand stores35% · —
Representation
Coded blocks · fashion & beauty197 · 214
Blocks with more than one age group1 of 117 with an index
Accessibility
Stores with cards lacking alt text21.4% · 5.6%
Cards lacking alt text14.2% · 3.4%
Exposure
Live stores with no recommendation block visible on the product page30% · —
Blocks covered by marketing pop-ups7% · 1%
Questions

Questions we get asked.

Do you work with the platforms?+
No. We audit from the outside — the way a shopper meets the shelf. No API access, no partnerships, no permission required.
Can I rerun the measurement?+
Yes. Sampling rules, seed selection, capture procedure, metric definitions and the visual-representation codebook are published on GitHub under CC BY 4.0. Any researcher can rerun it on the same platforms or on one we have not reached.
Are individual stores named?+
No. Stores are anonymized by category and catalog size, and datasets are published without URLs. Extreme cases are reported as examples, never as identifiable storefronts.
Where are the data?+
Anonymized datasets are deposited on Zenodo with DOIs alongside each publication — September 2026. Capture losses are reported, never silently dropped.
Are the figures on this site final?+
They are pre-publication figures from the program’s frozen analyses. Both papers are in preparation; the published versions take precedence over anything shown here.
AVBR
Open science

Rerun the shelf yourself.

The protocol, codebooks and datasets are open. Take the measurement to a platform we have not reached yet — or write to the lab.

Protocol v2.1 · CC BY 4.0Datasets with DOIs · ZenodoNo platform cooperation